Retail business owners have a lot to oversee. Although they set performance goals, it can be hard to track their progress. Fortunately, numbers don’t lie, so, business owners can use reliable equations to measure their business’ progress. These equations are called metrics. Metrics help determine the health and success of your business. Retail KPIs are the most important metrics to measure.
What are Retail KPIs?
Retail KPIs, Key Performance Indicators, are the vital metrics of a business, as they monitor the growth and performance. They help track sales, inventory, customer satisfaction, and more. Based on these measurements, you can set a target level of performance and use KPIs to monitor progress. Marketing and promotional decisions should be based on this data in order to make the best decision.
Every retail business has different needs, so each one will use different KPI metrics. This article will discuss several, along with the formulas to calculate them. The 18 retail KPIs in this article fall under these categories:
- Customer metrics
- Sales metrics
- Transactional metrics
- Inventory metrics
- Growth metrics
This will assist you in finding the right retail KPI to grow your business.
Retail KPIs for Customer Metrics
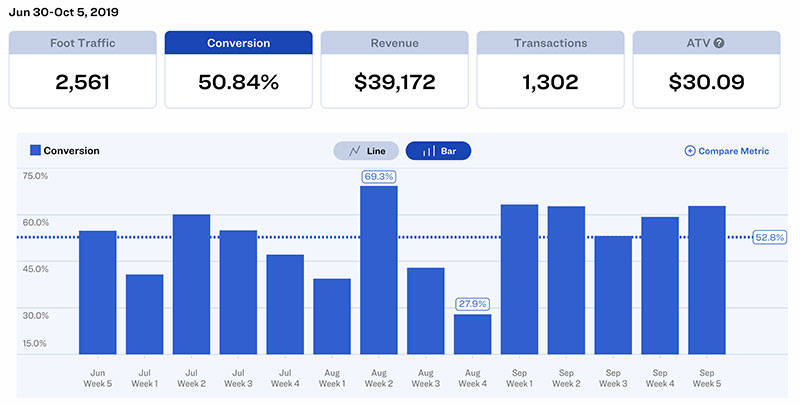
Conversion Rate
The conversion rate is one of the most important retail KPIs. It measures how many of those who visit your store purchase something.. Retail businesses need customers to buy, so this equation amounts to your success.
The equation to calculate the conversion rate is:
Conversion Rate = Number of Visitors / Number of Individual Purchases x 100
For example, if 100 people visit your store in one day, but only 10 people make a purchase, the conversion rate is 10%.
Why use this retail metric?
This retail KPI can measure the efficiency of operational actions.
Tips for improving:
If the conversion rate is low, train your employees to improve their sales, change the layout of the store, or include more promotions.
Customer Retention
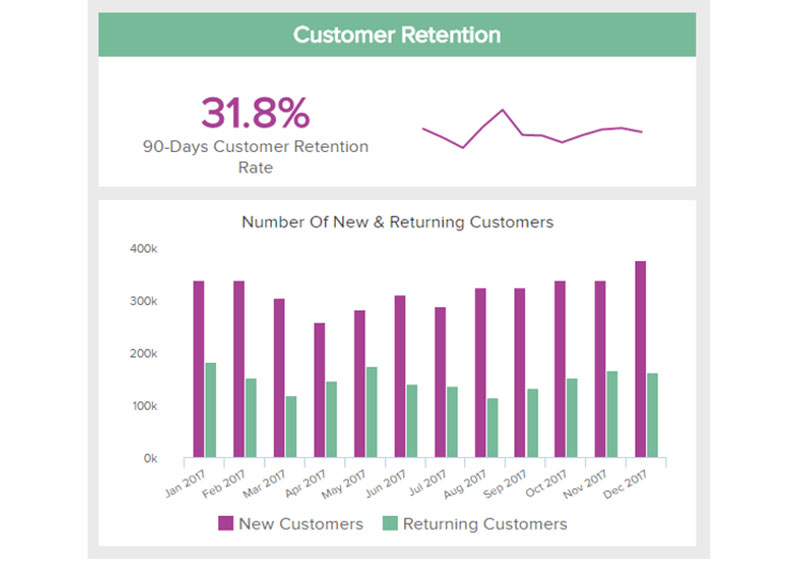
Customer retention measures how many of your new customers return. This is important because it is more expensive to obtain new customers than to keep them. Returning customers also spend more than new customers.
The equation to calculate customer retention is:
((Number of Customers at the End of a Period – Number of New Customers Obtained) / Number of Customers at the Start of the Period) x 100
For example, at the start of a period, you have 95 customers. During that period, you gain 40 new customers, and at the end of that period, you have a total of 110 customers. In that case, it would look like this:
((110-40) / 95) x 100 = 73.68%
Why use this retail metric?
This KPI metric helps you determine the quality of your customer service and products. It can also provide insight into the overall appeal of your store, like cleanliness or layout.
Tips for improving:
Excellent customer service is a vital part of customer retention. Therefore, improving customer service is important. Another good option is to implement a loyalty program.
Customer Satisfaction
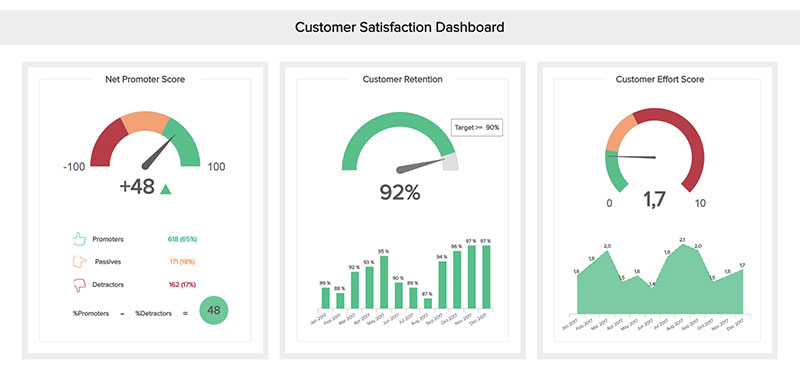
This metric is associated with customer retention since the satisfaction of the customer will determine if they’ll return. This can be measured with a Net Promoter Score or NPS. NPS measures how willing customers are to recommend your business to others. You can also survey your customers after a transaction or use a suggestion box to determine the level of satisfaction. Web analytics, like bounce rate and dwell times, can provide further insight.
Foot Traffic
This KPI metric calculates how many people walk into your business. Naturally, the more people coming in, the better chance of making a sale. You can use manual counters or cameras to collect the data.
Why use this retail metric?
It can help you determine how successful your advertising efforts are. It also helps you evaluate the success of a new brick-and-mortar location. Or, you can use it to determine the effectiveness of a window display.
Tips for improving:
If you aren’t getting a lot of foot traffic, you will need new marketing strategies to drive people in. For example, you can host events or increase your curb appeal. Utilizing online tools can also attract attention to your store. Google’s local inventory ads can showcase your store to shoppers nearby. There are several other online tools at your disposal.
Customer Acquisition Costs
Customer acquisition costs (CAC) is the amount of money you spend obtaining new customers. This includes marketing, ad campaigns, or any other expenses used to gain new customers.
The equation for customer acquisition costs is:
Customer Acquisition Cost = Marketing Costs / Customers Acquired
Why use this retail metric?
By using this KPI metric, you can assure the money spent to acquire new customers is worth it. It will provide insight into any adjustments needed to make your advertising and marketing campaigns more effective.
Tips for improving:
To lower customer acquisition costs, first, identify your customer demographic. Then, design marketing campaigns to appeal to that target audience. Referral programs can be started to increase your brand’s awareness and promote services at no extra cost to you. Social media can also be used effectively in this area.
Retail KPIs for Sales Metrics
Total Sales Count
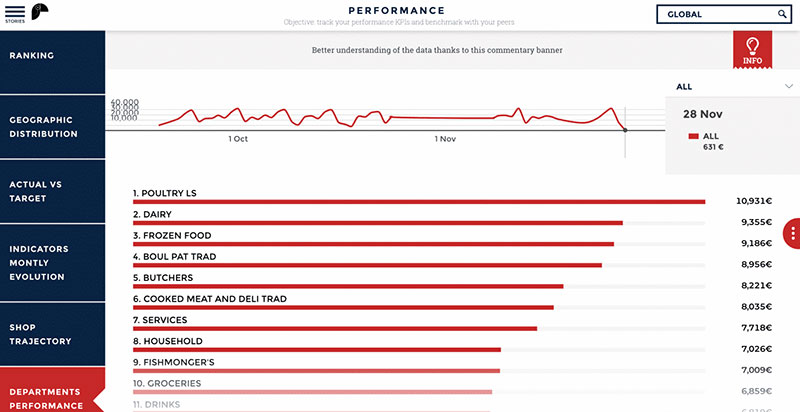
This is one of the most straightforward retail KPIs. It measures all sales made over a period of time. It can measure all the sales over several locations, including online sales. This will give you an overall view of business performance. You can also use it for a more comprehensive view of your business by filtering the total sales count into categories.
Why use this retail metric?
Monitoring this metric reveals high and low demand patterns. This metric can also be used to conduct A/B testing between different stores. You can customize each store with the tools needed to make sure sales grow based on the data.
Sales per Square Foot
This metric measures the number of sales compared to the square footage of your store, excluding dressing rooms and stockrooms. Some businesses make their sales per square foot public. By analyzing this metric, you can compare it with other businesses to gauge where your business should be. This KPI is useful when planning the layout of your store.
The equation for sales per square foot is:
Net Sales / Amount of Sales Space
Why use this retail metric?
Use this KPI to determine if you are maximizing the space and fixtures available.
Tips for improving:
Products displayed at eye level are bought more frequently. Putting small or consumable items at the register prompts impulse buying. Creating an organized layout will encourage customers to buy more.
Sales per Employee
The sales per employee metric can be useful when making decisions like hiring, compensation, and rostering.
This is the equation to use for sales per employee:
Net Sales / Number of Employees
Tips for improving:
Training and incentive programs will encourage your employees to make more sales. Setting individual goals for employees can also help increase sales per employee.
For a more comprehensive view, you can take this equation a step further by measuring the revenue generated by each employee.
Sell-through Rate
This metric measures how quickly merchandise moves out of the store.
The equation for the sell-through rate is:
Sell-through Rate = Number of Units Sold / Beginning Inventory x 100
Why use this retail metric?
By using this data, you can make better purchasing decisions. Calculating a product’s sell-through rate will help you avoid empty shelves or overstocking.
Retail KPIs for Transactional Metrics
Average Transaction Value
This metric determines the average amount of money a customer spends each time they visit your store. A high transaction number could indicate that customers are buying costly items or multiple items. A low number could indicate an inventory of inexpensive items or an imbalance in the pricing structure.
The equation for average transaction value is:
Total Dollar Amount of Sales / Number of Distinct Transactions
Tips for improving:
Merchandising strategies can increase the amount customers spend each time they come to your store. Options include introducing purchasing incentives and implementing cross-selling and up-selling techniques.
Units per Transaction
The units per transaction metric shows the number of items bought in one purchase. The higher the number, the more customers are enjoying the shopping experience. The enjoyable environment encourages them to stay longer and buy more. It is also a good indication that your products appeal to your customer demographic.
The equation for units per transaction is:
Units per Transaction = Total Number of Items Bought / Number of Transactions
Tips for improving:
A well-designed store layout gives shoppers an enjoyable experience and creates opportunities for customers to buy additional items.
Profit Margin
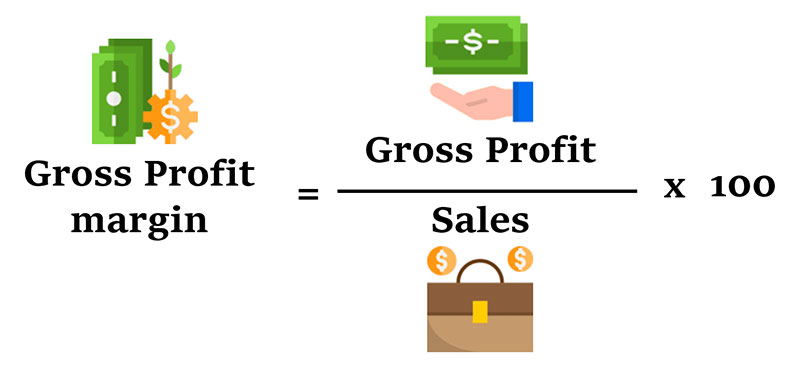
There is no overstating the importance of knowing how much money you are profiting. Your profit margin is the most essential retail KPI.
Why use this retail metric?
This metric tells you how much money you are actually pocketing. Monitoring your profit margin provides information about what adjustments to make to product prices or overall operation costs.
The equation for profit margin is:
Profit Margin Percentage = (Gross Profit / Total Revenue) x 100
Tips for improving:
After considering the possible downsides, you can raise the prices of your products to increase your profit margin, or decrease operational costs. You can also make effective use of vendor relationships to obtain products at a better price.
Retail KPIs for Inventory Metrics
Inventory Turnover
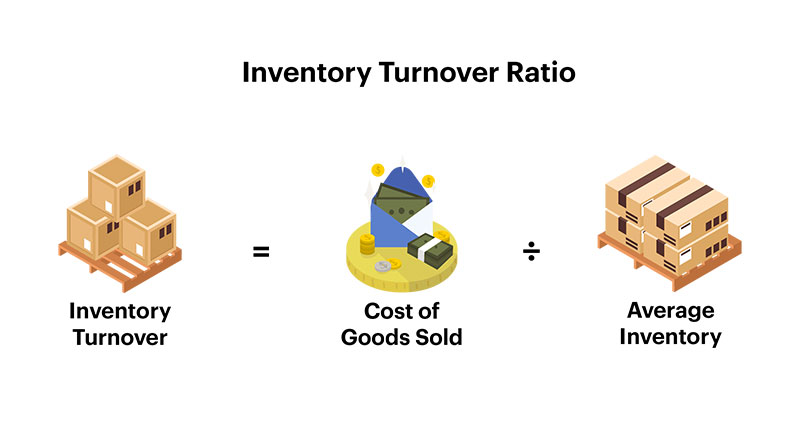
This metric measures how much inventory is sold during a period of time. If the number is low, it is an indication that you aren’t selling enough and could end up being overstocked. A high figure indicates that you are selling a large number of products and might need to order more to avoid running out.
The equation for inventory turnover is:
Cost of Goods Sold / Average Inventory
Tips for improving:
To move products that aren’t selling well, you can discount them, generate demand, or discontinue them. This will make room for better-selling products.
Gross Margin Return on Investment (GMROI)
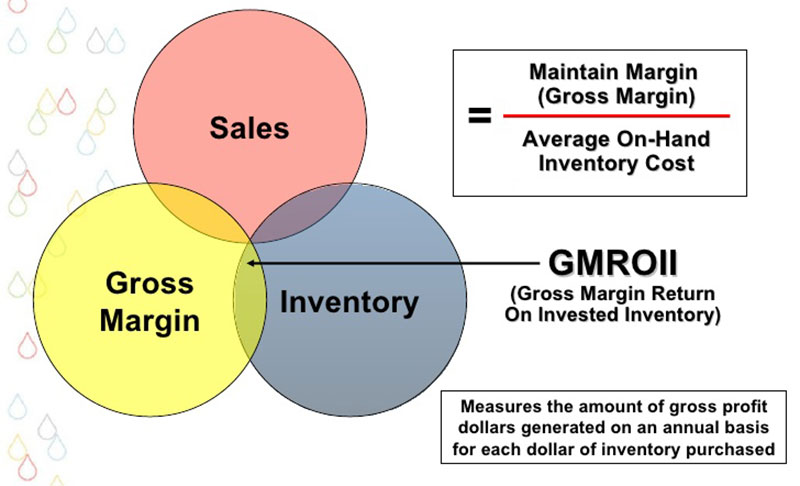
Gross margin return on investment, or GMROI, measures the gross margin earnings of specific products. This is one of the most important retail KPIs because it shows you the return on your investment for your inventory products. Products that have a good return on initial costs mean growth for your business.
The equation for gross margin return on investment is:
Gross Profit / Average Inventory
Why use this retail metric?
With this KPI, you can determine if products are profitable enough. It shows which products are worth stocking and investing. With this information, you can make sure to stock your store with the most profitable products and increase growth.
Inventory Shrinkage
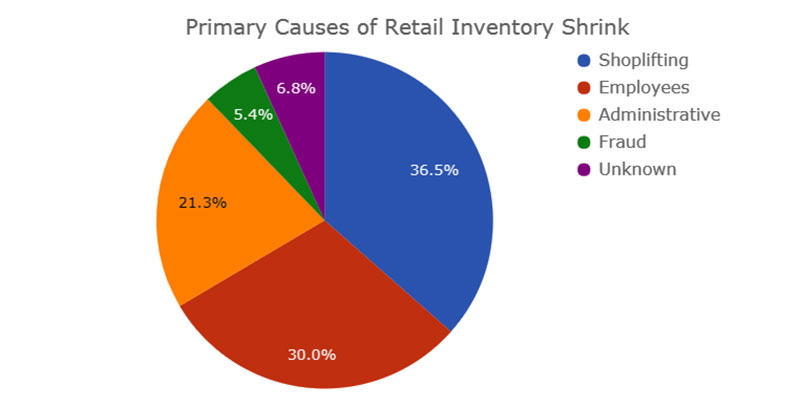
Shrinkage is a loss of inventory caused by things other than sales. Shrinkage is inevitable in any business, especially due to damaged goods. However, theft from shoppers or employees can cause shrinkage and needs to be addressed. Administrative or supplier errors can also be the cause. Whatever the cause, it negatively impacts your profits. Monitoring this metric can help you decrease any inventory shrinkage.
The equation for inventory shrinkage is:
Shrinkage = Value of Inventory that is Supposed to be in Stock / Value of Physically Counted Inventory
Tips for improving:
The first step to decreasing inventory shrinkage is identifying the biggest perpetrator. The next step would be implementing methods to prevent it. For example, you can increase store security or enhance employee screening.
Product Return
This metric measures how many products are returned to your business.
Why use this retail metric?
This retail KPI can help you identify product faults, poor customer service, or bad marketing promises. Investigating the cause of returns and making adjustments can help improve your business.
The equation of product returns is:
Product Return Percentage = (Number of Returns / Number of Items Sold) x 100
Retail KPIs for Growth Metrics
Year-Over-Year Growth
This retail metric compares your current financial situation with that of previous years. It measures the last twelve months to see if the business is growing and the percentage of that growth.
The equation for year-over-year growth is:
Year-Over-Year Growth = (Current Period Revenue – Prior Period Revenue) / Prior Period Revenue x 100
Why use this retail metric?
This KPI highlights long term trends and gives you a comprehensive look at the health of your business. For example, you can have a 15% increase one month over the previous month.
However, looking at your year-over-year growth, you might find that there is an actual decrease in growth. Continuous or fast growth indicates you are doing something right. Stalled growth indicates that you need to make adjustments.
Sales Growth
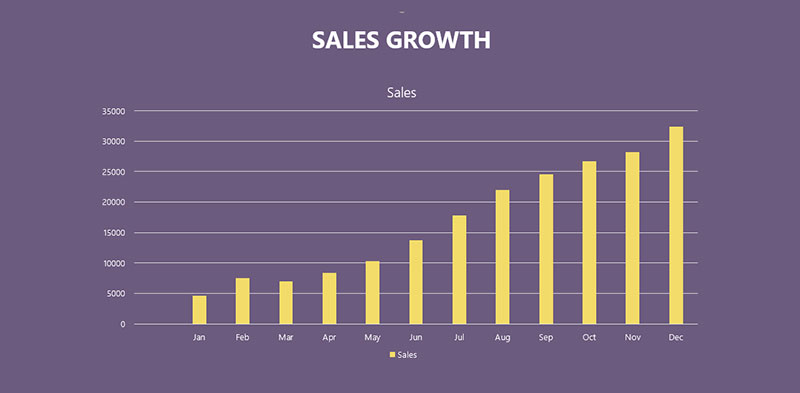
This metric measures sales growth in short periods of time, like month to month.
The equation for sales growth is:
((Sales for the Current Period – Sales for the Previous Period) / Sales for the Previous Period) x 100
Why use this retail metric?
Startup companies can’t use the annual sales revenue metric. This KPI gives them data that they can analyze now and make decisions accordingly. This KPI is used by executives and board of directors to make decisions on business strategies. This KPI can also give your teams a goal to work toward.
Ending thoughts on retail KPIs
Retail KPIs measure the success of a business. Each business will use different KPIs depending on their needs. KPIs provide data to help you make wise decisions regarding the growth of your business.
Customer metrics help you make sure your products and marketing campaigns appeal to your ideal demographic. Sales and transactional metrics provide data for product stock and layout.
Inventory metrics supplies information to prevent understocking, overstocking, and shrinkage. Finally, growth metrics assess the overall health of your business to keep you focused on your long-term goals.
Unfortunately, small business owners lack enough time to sit down and calculate these KPIs, however software is available to help.
Pack4it is a multi-channel POS system that helps business owners with physical stores or online businesses. It monitors and reports the data from all 18 of these retail KPIs, allowing you to make wise decisions that benefit your business.
This will help you keep pace with competitors, focus on your goals, grow your business, and make more money.